
Health disparities children
- Summary
-
Differences in health and lifestyle
Children who are more likely to have a poorer quality of life and health come from:
- Families with low income
- Single-parent families
- Families with co-parenting
Children with poorer lifestyles come from:
- Families with low income
- Single-parent families
They exercise and move less, are more likely to have high screen use and less likely to control gaming behavior.
Some differences in mental health and exercise and sports are widening. Children who are falling further and further behind are:
- For mental health: children from single-parent families or living in Vleuten-De Meern or Leidsche Rijn
- For exercise and sports memberships: children with a non-Western migrant background or who live in Zuidwest or Overvecht
Some differences in perceived health, alcohol, and breakfast are narrowing as groups with poorer health or lifestyles show (more) favorable trends:
- For perceived health: children with a Turkish migration background and from the districts of Zuid, Zuidwest, Noordwest and Overvecht
- For occasional drinking of alcohol: children without migration background and from the districts Noordoost, Oost or Vleuten-De Meern
- For breakfast: children from Overvecht or Noordwest and children with a Turkish migration background
Some differences in screen use and control over gaming behavior are diminishing, as groups of children who scored more favorably are beginning to use screens more often and have less control. This applies to:
- Girls
- Children without migration background (screen use only)
Differences in opportunities for a healthy life
The following groups of children have, on average, fewer opportunities for a healthy life:
- Children with low family income
- Children from single-parent families
- Children from other non-Western migration backgrounds
Differences in the social and physical environment between children with low and high family income tend to widen, since children from low-income families:
- experience an increase in discrimination
- increasingly have a family member with long-term illness, disability or addiction
- experience a less rapid decline in bullying at school
- experience an increase in feelings of insecurity at or around school and playgrounds
Children from single-parent families fall further behind because they:
- experience an increase in discrimination
- are less likely to feel safe
- are slightly more likely to live at the welfare level for long periods of time.
Points of leverage to address health disparities in children
Some groups of children in Utrecht need something more or something different to close their health gaps or have equal opportunities for health. Children from low-income and single-parent families are structurally disadvantaged in health, lifestyle and opportunities for a healthy life, and often fall further and further behind. Children from other non-Western immigrant backgrounds have fewer health opportunities.
- Introduction
-
Health disparities emerge at an early age and become more pronounced as children age. This has been shown by national and international research and also by research among Utrecht children. The attention and commitment to health inequalities is high both nationally and in Utrecht. An important question is: What exactly are the health disparities among Utrecht children? And do these differences become smaller or larger over time? In this special edition of the Utrecht Public Health Monitor (VMU), we describe differences in health, lifestyle, and health opportunities among Utrecht children in grades seven and eight (10- to 12-year-olds). Attention is paid to differences by gender, family income, migration background, family composition and district. We also show whether these disparities have increased or decreased in recent years. Information on general developments for topics is listed in this summary. This special issue focuses on the development indifferences in these topics.
The likelihood of a healthy life is determined by the conditions in which you grow up, learn, live, and prosper. These conditions determine a person's health and are called the underlying causes of health. This special issue focuses on the underlying causes that the World Health Organization (WHO), the G4 and the Utrecht Health Model also identify, namely the social environment, physical environment, health care, and whether children grow up in poverty.
The figures are largely based on data from the Utrecht Youth Monitor (JMU). This is a biennial questionnaire survey of Utrecht children in grades seven and eight of elementary school. In 2021, over 2,700 children from 44 Utrecht elementary schools participated from October to December. For most of the JMU indicators, data are available for the period 2008 through 2021, we therefore primarily describe long-term trends. In addition to the JMU data, we used data from the CBS on poverty from 2015 to 2020 and registration data on neighborhood team support and youth care from the municipality from 2020/2021. The named differences between groups and trends in differences are all statistically significant.
The most recent data was collected during the corona pandemic. These figures provide initial insight into the situation during the corona pandemic. We point out that this is a snapshot and only one measurement point in an exceptional period.
This special issue of VMU focuses on health disparities among children ages 10-12. In September 2021, a special issue was released on thefirst 1,000 days of Utrecht children. In the current special issue, we have included a summary on health disparities among these children. A summary of health disparities among youth in grades two and four of secondary school was also added. Simultaneously with this special issue on children, we are also publishing a second edition of the Monitor onhealth disparities and health opportunities in adults.
- Reader's Guide
-
In this issue, we describe differences among Utrecht children in grades seven and eight by gender, family income, migration background, family composition, and district.
For each topic, we describe:
- The indicators we use
- The most recent differences in Utrecht, mostly in 2021
- The trend in these differences, mostly from 2008 to 2021
Finally, we provide a brief summary of health disparities among young Utrecht children (up to age 2) and Utrecht adolescents in classes two and four of secondary school.
Distribution of Utrecht 10- to 12-year-olds by gender, family income, family composition, migration background and district
Image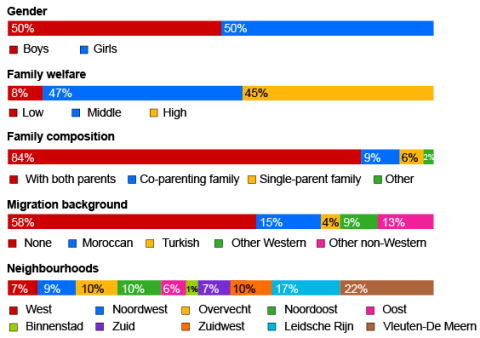 The distribution by family income and family composition is based on the group of children who participated in the Youth Monitor Utrecht 2021. The remaining indicators are based on data on the entire population of 10- to 12-year-olds in Utrecht.
 - Health
-
Quality of life
The following indicators were used to describe quality of life:
- Percentage of children with (very) good perceived health
- Percentage of children who usually feel (very) happy
- Percentage of children who are (very) worried about the future
Differences in quality of life by family income, family composition, migration background and district
In 2021, children in grades seven and eight who lived with both parents and children who lived in the Noordoost district were more likely to have a better quality of life than other children in Utrecht. Children with low family income, from co-parenting families, from single-parent families, and from other non-Western immigrant backgrounds are more likely to have a poorer quality of life. For example, 23% of children with low family income worry a lot about the future. This is 12% among children with high family income. Among children from other non-Western migration backgrounds, 21% are very worried about the future.
Children in low-income families are less likely to have good perceived health by 2021
Image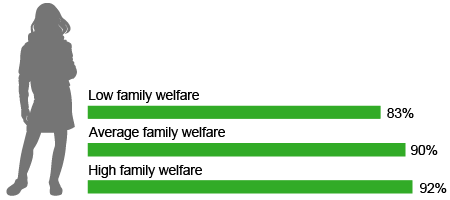
Differences in quality of life are mostly stable, but decrease by migration background and district
The differences across years in quality of life are mostly stable. Differences in perceived health and concerns about the future do narrow between groups with different migration backgrounds and between Utrecht districts. There is an increase in differences in many worries about the future by family income.
The differences in perceived health between groups with different migration backgrounds and between Utrecht districts disappear between 2008 and 2021. The perceived health of children with a Turkish migration background and of children living in the districts of Zuid, Zuidwest, Noordwest and Overvecht is improving to such an extent that they no longer differ significantly from other children. Differences in many worries about the future become smaller between 2019 and 2021 by migration background and districts, as children with a Turkish migration background and children living in Overvecht were significantly more likely to be much worried about the future than other children in 2019, but scored average in 2021. Differences in many worries about the future increase by family income, as it increased sharply among children from low-income families.
Percentage of children with good perceived health by migration background
Infogram URLPhysical and mental health
The following indicators were used to describe physical and mental health:
- Percentage of children who have had many physical complaints in the past week
- Percentage of children at increased risk of psychosocial problems
- Percentage of children who feel stressed (very) often due to one or more factors
- Percentage of children with feelings of fear of failure
- Percentage of children with a favorable score on self-esteem
Differences in health by gender, family income, family composition, and district
Girls, children with low family income, children from a family with co-parenting or single-parenting, and children from Leidsche Rijn and Vleuten-De Meern are more likely to have poorer health in 2021. For example, 34% of children from Leidsche Rijn and Vleuten-De Meern often feel stressed and 36% of children from families with low family income. The average in Utrecht is 29%. 29% of children from single-parent families and 27% of children from co-parenting families are at increased risk of psychosocial problems. This is lower among children living with both parents, at 14%. Physical and mental health is more likely to be better among boys, children living with both parents, and children from the Noordoost and Oost districts.
Girls more likely to have had many physical complaints in the past week in 2021
Image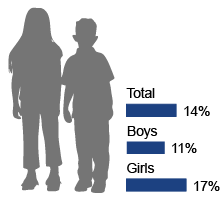
Increase in mental health disparities by family composition and district
Some differences in mental health are widening, while differences in physical health are stable. In particular, differences in mental health by family composition and district are widening. Between 2010 and 2021, for example, the risk of psychosocial problems rose more sharply among children from single-parent families than children who live with both of their own parents. We also see this same pattern for feelings of fear of failure in children from single-parent families.
Percentage of children at increased risk of psychosocial problems by family composition
Infogram URLDisparities in mental health between districts have also increased, including a stronger increase in fear of failure and the risk of psychosocial problems among children from Vleuten-De Meern and Leidsche Rijn, increasing their disadvantage over the past decade.